Setting custom confidence score thresholds
Applying a confidence score threshold can help optimise the time spent reviewing the results, by automatically creating a validation rule that allows for selected review on low confidence datapoints.
What is a confidence score?A confidence score is a number (usually between 0.0 and 1.0) that tells you how 'sure' the AI system is about a prediction or answer it's giving you. Higher scores mean the system is more confident in its answer.
The biggest problem is understanding what is a good threshold for your specific use case, or even down to a particular field. However, setting a confidence threshold helps you automatically handle AI predictions - auto-accepting high-confidence answers and flagging low-confidence ones for human review. This saves time and improves accuracy.
Super.AI provides a comprehensive set of tools to help you understand the correct threshold you want to set to optimise for accuracy or review time.
How to find the best confidence score threshold
To display the metrics for your data we're going to need ground truth. It's worth mentioning the steps required to create the ground truth and the datasets, since they differ from the ground truth creation steps taken with the objective of training a model.
1. Review documents specifically for confidence score insights
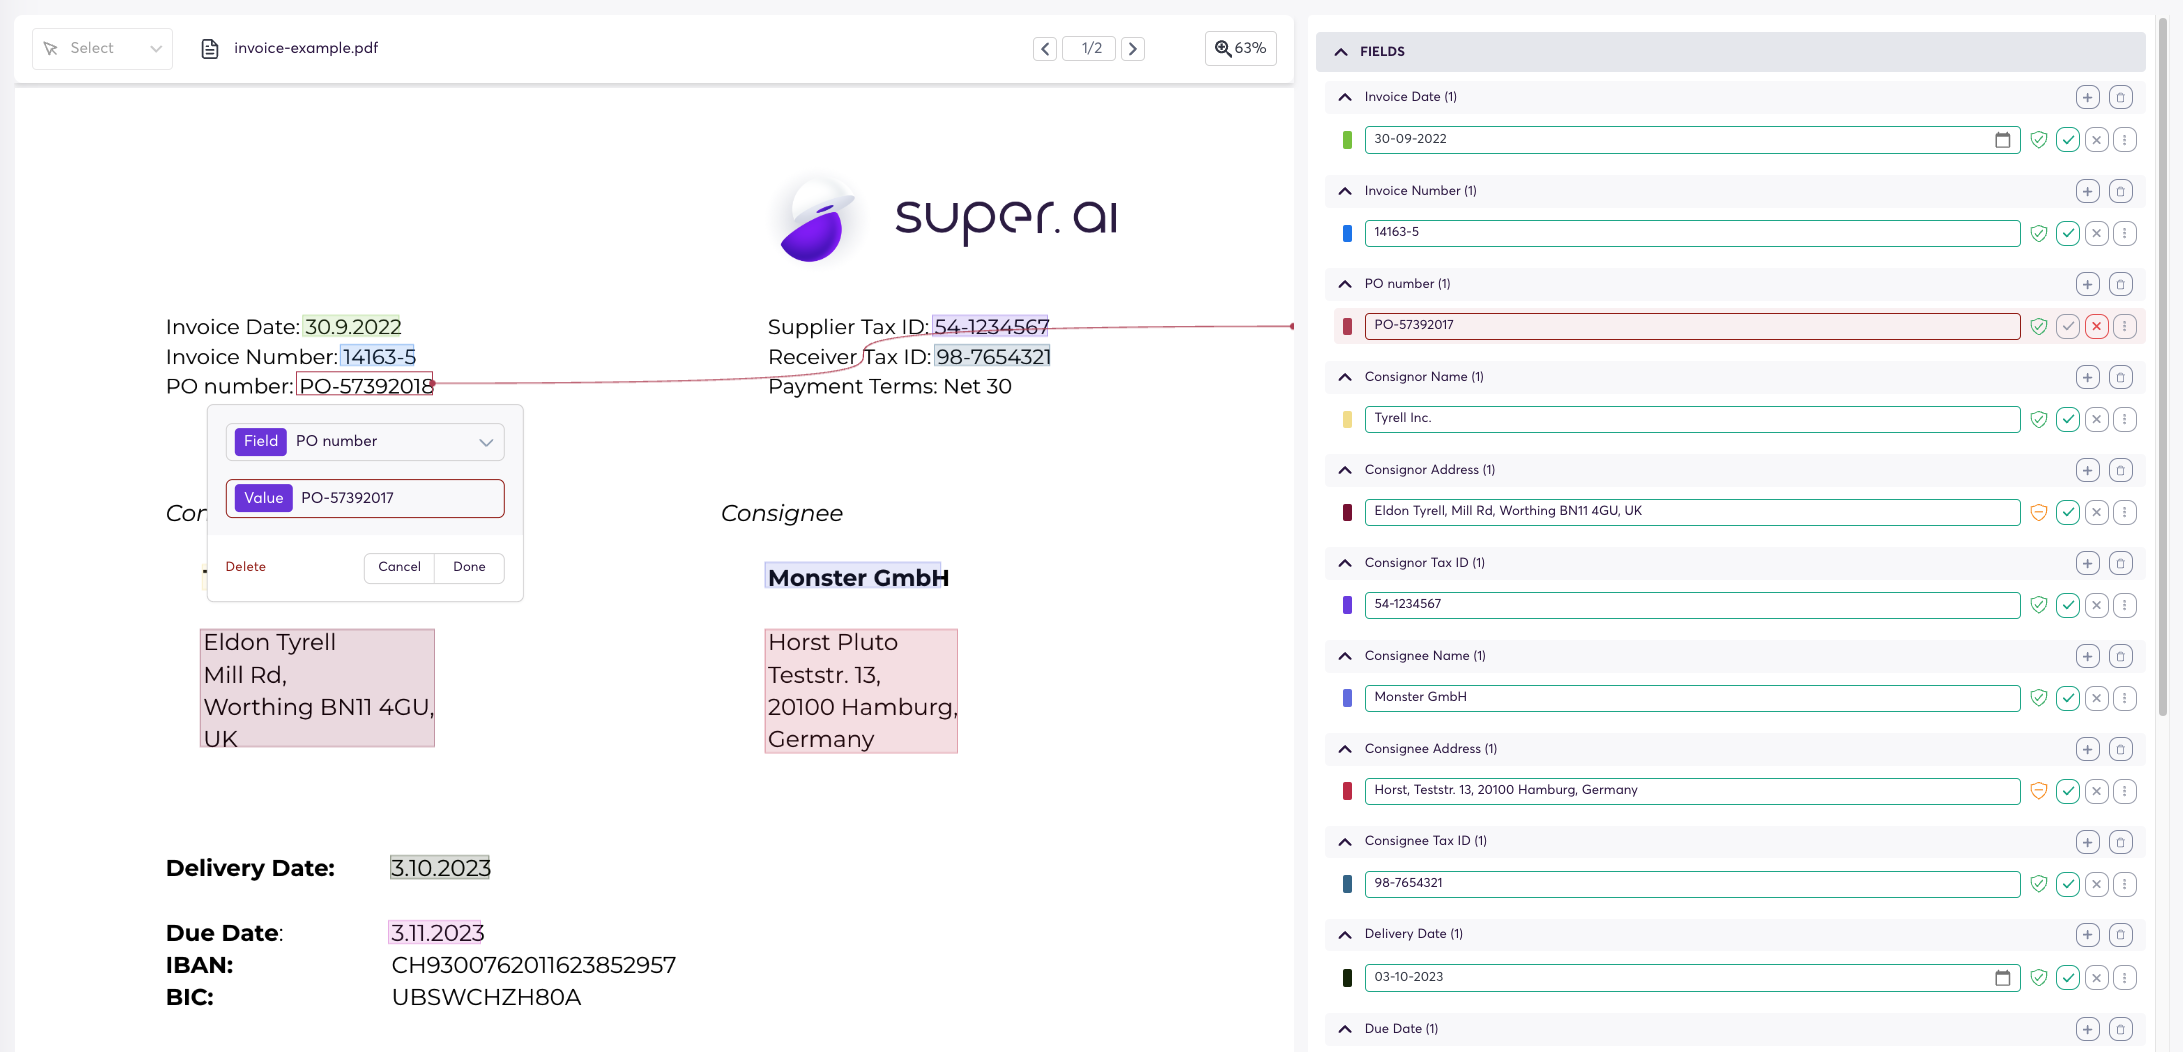
Review the completed or post-processed data points by marking fields as correct or incorrect. Do not alter the extractions, as it is crucial to retain negative samples in the dataset for accurate confidence calibration.
There's no need to review all fields, just the ones that you want to set up the threshold for - but make sure to review at least 30 data points for a significant sample.
Remember to confirm your selection. When prompted to choose an action for unreviewed fields, it's best to select 'Do nothing' if you don't want to provide feedback on fields other than those you've already reviewed.
However, if you'd like to specify the status of the remaining fields, you have two additional options: 'Mark all remaining fields as correct' or 'Mark all remaining fields as incorrect.'
2. Create a dataset specifically for confidence score insights
Head to the dataset section, and select "Training datasets". This will not be a training datasets, but the section is just temporary.
- Click "Add Dataset": Start by clicking on the button labeled "Add Dataset." This is the first step in creating a new dataset.
- Name Your Dataset: Give your dataset a clear and descriptive name. This helps you easily identify it later.
- Select a Task Name: Choose the task name that matches the work you intend to do with this dataset. This aligns your dataset with a specific purpose or operation.
- Choose the Right Data Points: Select the data points that you reviewed in the previous step. These should be carefully chosen based on your recent review and quality check.
Important Note: Do not select data points that were intended for training purposes, as these already have all fields corrected. Including these can affect your results.
By following these instructions, you'll ensure your dataset is correctly set up for your intended task.
3. Understanding the confidence score insights
Now it's time to see the metrics! They can be found in the statistics sections, under confidence. The first step is to select the dataset you just created on the left panel, after that select the field you want to work on.
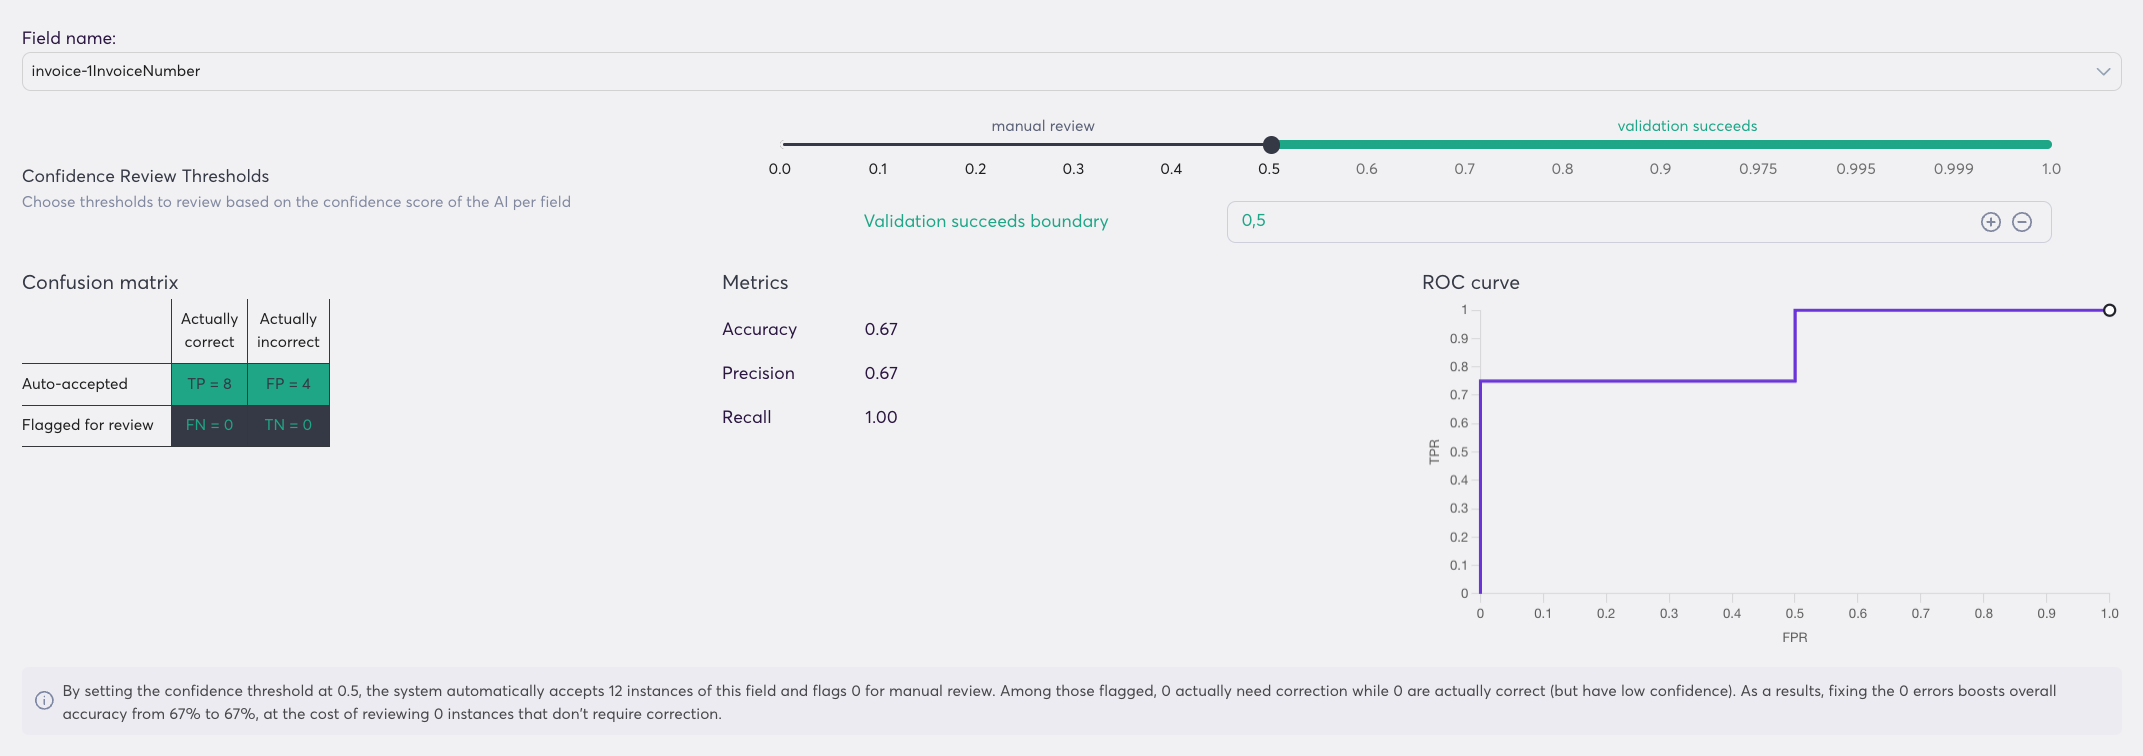
Our system uses two dynamic tools, namely a Receiver operating characteristic (ROC) curve and a confusion matrix to help you find the best threshold. The graph/values change as you adjust the threshold called validation succeeds boundary.
Understanding the ROC curve
- What is a ROC Curve?
The ROC (Receiver Operating Characteristic) curve is a helpful tool to visualize how well a model distinguishes between different outcomes. Think of it as a chart that shows the model's ability to make correct decisions. - How to Read the ROC Curve?
Imagine the curve as a line on a graph. If it covers more than half of the box, it suggests the model is making good predictions.
When the line is closer to the top-left corner, it means the model is doing a great job! - What if the Curve is Not Good?
In some cases, if the line does not cover more than half of the chart, it's like the model is just guessing randomly. In this case, it's better to pause and not jump to conclusions about the model's confidence.
Understanding the ROC curve in super.AI
- A good curve bends toward the top-left corner
- A straight diagonal line means the model is just guessing
- The more area under the curve, the better your model is working
Examples of ROC Curves
- Well-Calibrated ROC Curve (Left): This line shows the curve covering more than half of the chart, indicating reliable predictions.
- Not Well-Calibrated ROC Curve (Right): This line does not meet our expectations, so it's best not to trust the confidence levels from this.

4. Using the metrics to select a confidence threshold
When you find a calibrated confidence score based on the ROC curve, you want to have a look at the confusion matrix for this field.
Understanding the confusion matrix
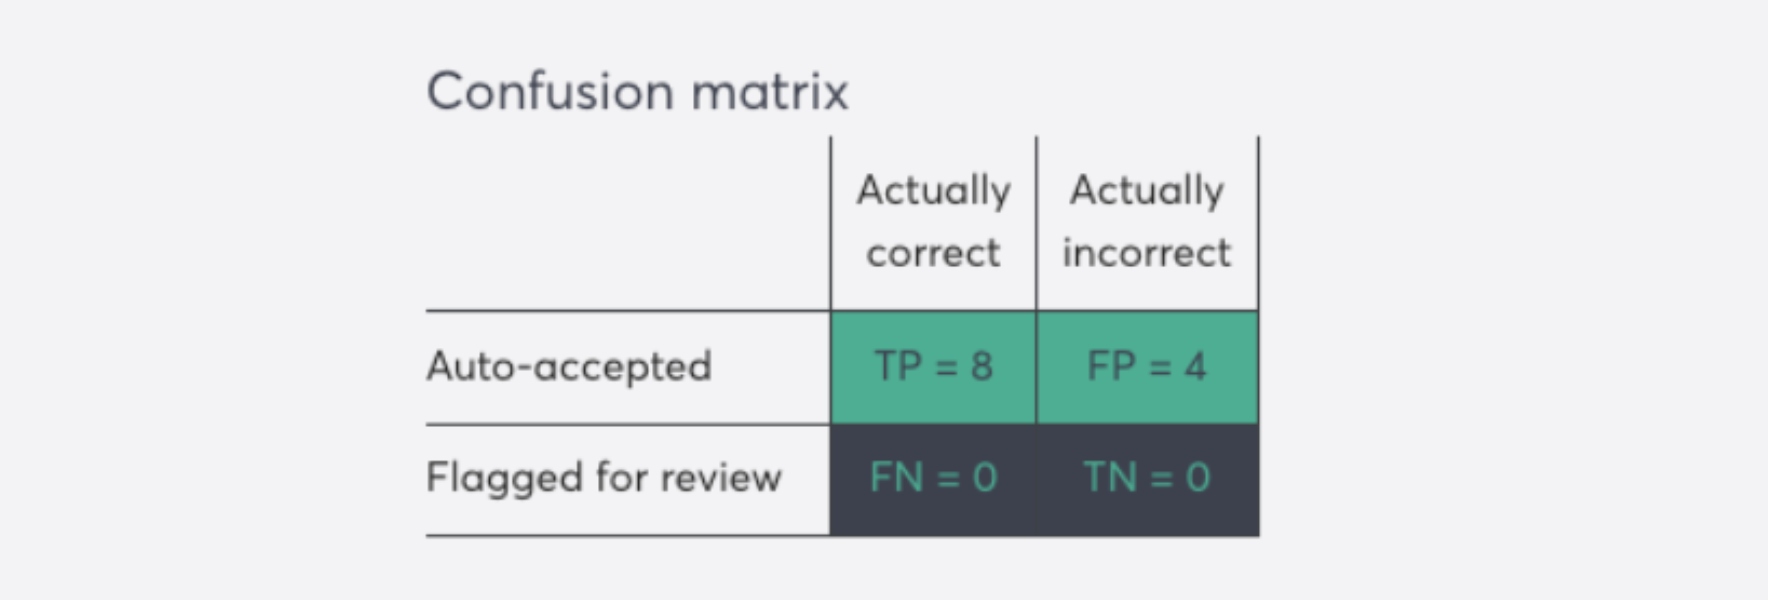
The confusion matrix is a simple table that shows how well your AI system is performing. Usually, it's a matrix that breaks down correct and incorrect predictions:
-
True Positives (TP): These are correct predictions that were automatically accepted.
In super.AI's confusion matrix, you find them in the quadrant Auto-accepted + Actually correct -
False Positives (FP): These are incorrect predictions that were automatically accepted.
In super.AI's confusion matrix, you find them in the quadrant Auto-accepted + Actually incorrect -
False Negatives (FN): These are items flagged for review that actually didn't need review (they were correct).
In super.AI's confusion matrix, you find them in the quadrant Flagged for review + Actually correct -
True Negatives (TN): These are items correctly flagged for review because they needed correction.
In super.AI's confusion matrix, you find them in the quadrant Flagged for review + Actually incorrect
By understanding this breakdown, you can see the real-world impact of your confidence threshold. A good threshold minimizes both incorrect auto-acceptances (FP) and unnecessary reviews (FN), saving you time while maintaining quality.
Super.AI helps you to understand the implications of the threshold with the dynamic explanatory sentence:
Super.AI helps you understand each threshold’s impact with dynamic explanationsBy setting the confidence threshold at X.X, the system automatically accepts TP+FP instances of this field and flags FN+TN for manual review. Among those flagged, TN actually need correction while FN are actually correct (but have low confidence).
As a results, fixing the TN errors boosts overall accuracy from XX% to YY%, at the cost of reviewing FN instances that don't require correction.
5. Settings the confidence threshold for a field
Once you’ve identified the appropriate threshold, navigate to the validation rules of each field to set a threshold that aligns with your quality and cost requirements.
After applying this minimum confidence threshold, any jobs where the confidence score for the field falls below this threshold will be moved to the Needs Review (see job states).
Be sure to revisit and adjust the threshold as needed, especially if the data distribution changes significantly, as this can impact confidence levels.
Updated 10 months ago